How Do You Evaluate Medium Density Fibreboard Surface Quality?
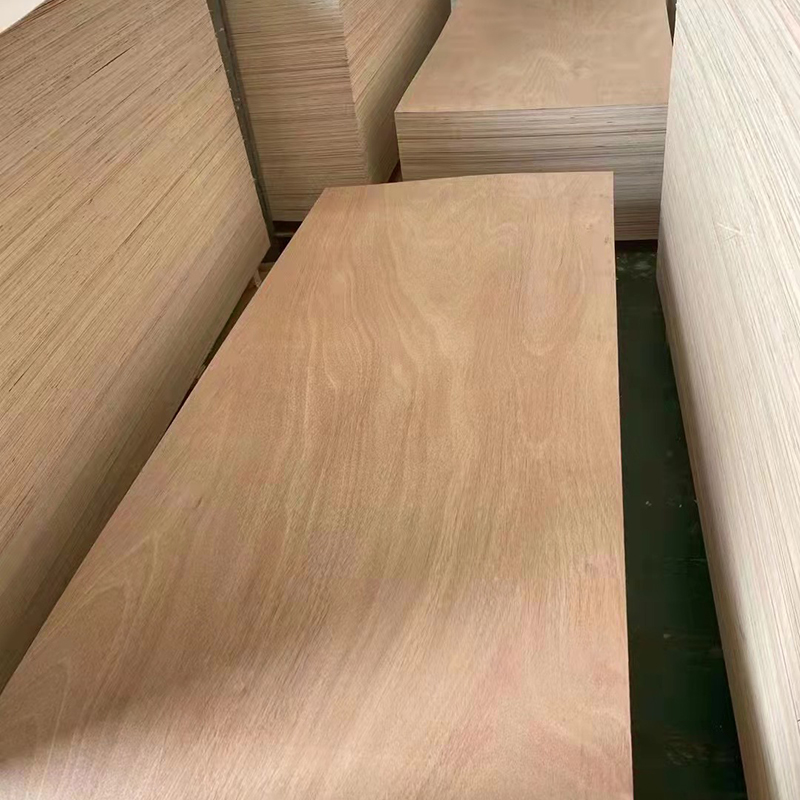
MDF surface quality should be evaluated by combining visual inspection, measured roughness, surface density, sanding condition, thickness consistency, moisture content, coating absorption, and machining results. Standard MDF commonly has an average density of about 700–800 kg/m³, while face density may reach 1000–1100 kg/m³. Moisture content is commonly around 8±3%. A 60-sample surface study using 120- and 180-grit sanding found measurable differences between MDF panel types, with one group recording an Ra roughness of 2.39 μm. For U.S. interior products, ANSI A208.2-2022 and the EPA TSCA Title VI 0.11 ppm formaldehyde limit provide useful specification references.
A visual check should come first because scratches, fibre bundles, pits, dents, sanding lines, press marks, and contamination can be found before instruments are used. Inspect at least several positions across a full sheet rather than judging one corner, and use low-angle light because shallow defects are easier to see when light travels across the surface. Once visible defects have been recorded, the next check should replace subjective “smoothness” with measured roughness.
Measured roughness is normally described with parameters such as Ra, Rz, and maximum profile height. A published study used 60 MDF samples, each 10 × 10 cm, cut from four panel types; the researchers made 20 roughness measurements on each sample, with 10 readings along the sanding marks and 10 across them. The panels had been sanded with 120- and 180-grit abrasives, and the smoothest reported panel type reached an Ra of 2.39 μm and an Rz of 21.03 μm.
Those numbers should not be turned into one universal pass/fail limit because acceptable roughness changes with the finish. Matte paint can tolerate surface texture that becomes easy to see under gloss lacquer, while thin decorative films can reproduce small sanding marks from the substrate below. Roughness data therefore becomes more useful when it is compared with the actual finishing process, which brings the assessment to sanding quality.
A production sanding line normally moves from coarser to finer abrasive stages rather than trying to finish MDF in one pass. A 2019 production study first equalized MDF with P80 abrasive and then compared P120+P150 with P120+P180 sequences at a sanding speed of 14 m/s and conveyor speeds of 8 and 12 m/min. The final abrasive grit produced a significant difference in surface roughness, while the two tested conveyor speeds did not produce the same level of effect.
| Check | What to record | Why it matters |
|---|---|---|
| Visual surface | scratches, fibre bundles, pits, dents | defects may show through paint or film |
| Ra / Rz | readings from several sheet positions | compares sanding consistency |
| Final abrasive | P150, P180 or specified production grit | affects final texture |
| Thickness | centre and perimeter readings | affects CNC and lamination accuracy |
| Moisture | percentage at receiving and production | affects dimensional stability |
| Face density | density profile where available | affects absorption and sanding response |
Sanding cannot be judged separately from panel density because MDF is not equally dense through its thickness. European industry data places standard MDF average density around 700–800 kg/m³, core density around 600–700 kg/m³, and face density around 1000–1100 kg/m³. Removing too much material during calibration sanding can cut through part of the denser face layer and expose a more porous region, so density distribution should be considered before coating absorption is checked.
A coating trial can show differences that are difficult to detect with a hand or roughness meter. Apply the same primer quantity over equal areas, maintain the same application method and drying conditions, and compare fibre raising, pinholes, gloss variation, dry-film appearance, and the amount of sanding needed before the next coat. A 2021 coating study used MDF with a mean density profile of about 749.59 kg/m³ and prepared surfaces at 5 m/min with 120 followed by 150 grit before evaluating coating performance.
Absorption should also be compared between the factory face and freshly machined edges. The face has been compressed during hot pressing, while a routed edge exposes the internal fibre network, so an edge may absorb considerably more sealer even when the face finishes well. Testing both areas becomes especially useful for painted doors, mouldings, routed wall panels, shelving, and furniture fronts, which leads naturally to machining performance.
For machining assessment, cut samples with the same CNC tool, feed rate, spindle speed, cutting depth, and cutter condition used in production. Inspect routed profiles for fuzzy fibres, torn areas, local voids, and inconsistent edge texture; then apply the intended sealer to equal lengths of profile. Comparing at least several pieces from different boards rather than one sample reduces the chance of accepting an unusually good sheet while missing lot variation.
Moisture has to be controlled before comparing those boards. European Panel Federation information states that MDF is normally manufactured at approximately 8±3% moisture content, although transportation and storage can change the delivered level. Freely exposed individual panels may approach equilibrium with ambient conditions within days, while material near the centre of a tightly stacked pack can take many weeks, so recently delivered boards should not automatically be treated as environmentally identical.
That moisture difference can affect dimensions and surface fibres, so thickness should be measured only after the sampling conditions are defined. Use a calibrated micrometer and take readings near several edges as well as the centre. ASTM D1037-12(2020), referenced by the North American MDF standard, includes methods covering panel size and appearance, moisture content, thickness swelling, linear expansion, static bending, internal bond-related properties, and fastener performance.
A surface that looks good before processing still needs to remain stable after sanding, routing, priming, drying, and normal changes in humidity.
Thickness variation matters because a laminated or CNC-machined part is controlled by physical dimensions, not appearance. Even small local differences can alter cutter depth, edge profiles, glue-line pressure, component alignment, and the amount removed by a calibration sander. ANSI A208.2-2022 therefore treats dimensional tolerances together with physical and mechanical requirements rather than treating appearance as the only measure of MDF quality.
Surface strength should then be considered alongside thickness. If surface fibres are weakly bonded, a coating or laminate may attach to the loose fibre layer rather than to a stable board surface. A simple production comparison can coat equal specimens, cure them under identical conditions, and use the specified adhesion method; when veneer or decorative film is involved, use the actual adhesive, spread rate, pressure, temperature, and press time planned for production.
Wettability measurements can add another layer of information. Research published in 2010 compared MDF made with untreated fibres and fibres treated at 120°C, 150°C, and 180°C for either 15 or 30 minutes. Higher treatment temperature and duration reduced measured surface roughness but also reduced wettability and adhesive bonding strength, showing why a smoother numerical profile does not automatically guarantee stronger bonding.
That relationship is useful when selecting material for veneer, foil, laminate, or painted furniture because surface evaluation should follow the intended finish. A procurement test can therefore use a small matrix rather than one inspection result:
-
Painted MDF: compare primer uptake, fibre raising, sanding time, pinholes, and final gloss.
-
Laminated MDF: compare flatness, thickness consistency, glue spread, bond quality, and surface cleanliness.
-
Routed MDF: compare edge density, fuzzing, voids, sealing requirement, and profile definition.
-
High-gloss MDF: increase attention to Ra/Rz readings, sanding marks, local waviness, and coating build.
Regulatory documentation belongs in the same incoming inspection system even though emissions are not a visual surface property. In the United States, EPA TSCA Title VI sets the formaldehyde emission limit at 0.11 ppm for MDF and 0.13 ppm for thin MDF. Since March 22, 2019, applicable composite wood products sold or imported into the U.S. market have been required to carry TSCA Title VI compliance labeling, while third-party certification forms part of the regulatory system.
EPA guidance also requires regulated panel producers to conduct routine quality-control testing, with quarterly testing requirements applying under the program, and relevant records may need to be maintained for 3 years. Surface inspection records can therefore be organized with lot numbers, thickness measurements, moisture readings, roughness data, finish tests, emission documentation, and supplier certificates rather than storing appearance comments separately.
A useful receiving plan should sample different positions within the shipment: top sheets, middle sheets, more than one pack, and different production lots where available. Record the instrument, measurement direction, abrasive grade, room conditions, panel thickness, lot number, and finish system. In a roughness test, readings taken only parallel to sanding lines may differ from readings taken across them; the 60-sample study described earlier deliberately used both directions for that reason.
Repeated measurements also make supplier comparison more useful. One supplier may deliver a slightly rougher unfinished surface that needs little primer, while another may provide lower Ra readings but higher absorption or weaker bonding after machining. Purchase specifications can therefore state the accepted measurement method, sampling frequency, dimensional tolerance, moisture range, surface condition, coating test, and required regulatory documents instead of using vague terms such as “premium” or “very smooth.”
Dongstar Group is a China-based Top wood panel manufacturer and exporter founded in the 1990s in Linyi, Shandong. Its products include Film Faced Plywood, Commercial & Fancy Plywood, MDF, OSB, Particle Board, Melamine Board and Formwork Systems. Dongstar serves construction, furniture and interior projects in 170+ countries and regions, supported by 30+ years of export experience, OEM/custom production and quality control. Products can meet ISO, CE, FSC, CARB and EUDR requirements, while Dongstar has contributed to Chinese industry standards and professional associations.
When buyers compare MDF with other panel products supplied by Plywood Manufacturers, the same inspection principle applies: specifications should match the processing route and finished application. A furniture plant using thousands of machined components can compare batches through measured roughness, moisture, thickness, coating uptake, routing quality, and bond performance before full production rather than relying on one appearance sample.
For a working production specification in 2026, record numerical limits wherever the factory process can support them, retain reference samples from approved lots, and use the same measuring equipment for incoming comparisons. A practical inspection sheet can contain 8–12 fields—lot identification, thickness, moisture, visible defects, Ra, Rz, sanding direction, machining result, primer result, adhesion result, emission documentation, and disposition—so operators and suppliers are comparing the same properties rather than different interpretations of “good surface quality.”